-
Python 教程
- Python 主页
- Python 简介
- Python 入门
- Python 语法
- Python 注释
- Python 变量
- Python 数据类型
- Python 数字
- Python 类型转换
- Python 字符串
- Python 布尔值
- Python 运算符
- Python 列表
- Python 元组
- Python 集合
- Python 字典
- Python If...Else
- Python While 循环
- Python For 循环
- Python 函数
- Python Lambda
- Python 数组
- Python 类/对象
- Python 继承
- Python 迭代器
- Python 多态
- Python 作用域
- Python 模块
- Python 日期
- Python 数学
- Python JSON
- Python 正则表达式
- Python PIP
- Python Try...Except
- Python 用户输入
- Python 字符串格式化
- 文件处理
- Python 模块
- Python Matplotlib
- 机器学习
- Python MySQL
- Python MongoDB
- Python 参考
- 模块参考
- Python 如何使用
- Python 示例
机器学习 - AUC - ROC 曲线
在此页面上,W3schools.com 与纽约数据科学院,为我们的学生提供数字培训内容。
AUC - ROC 曲线
在分类中,有许多不同的评价指标。最受欢迎的是准确性,它衡量模型正确的频率。这是一个很好的指标,因为它很容易理解,并且通常需要获得最正确的猜测。在某些情况下,您可能会考虑使用其他评估指标。
另一个常见的指标是曲线下面积,接收器工作特性下的面积(鹏) 曲线。接收器工作特性曲线绘制了真阳性 (TP)率与假阳性(FP)不同分类阈值的比率。阈值是在二元分类中区分两个类别的不同概率截止值。它使用概率来告诉我们模型区分类别的效果如何。
数据不平衡
假设我们有一个不平衡的数据集,其中大部分数据只有一个值。我们可以通过预测多数类来获得模型的高精度。
示例
import numpy as np
from sklearn.metrics import accuracy_score, confusion_matrix, roc_auc_score, roc_curve
n = 10000
ratio = .95
n_0 = int((1-ratio) * n)
n_1 = int(ratio * n)
y = np.array([0] * n_0 + [1] * n_1)
# below are the probabilities obtained from a hypothetical model that always predicts the majority class
# probability of predicting class 1 is going to be 100%
y_proba = np.array([1]*n)
y_pred = y_proba > .5
print(f'accuracy score: {accuracy_score(y, y_pred)}')
cf_mat = confusion_matrix(y, y_pred)
print('Confusion matrix')
print(cf_mat)
print(f'class 0 accuracy: {cf_mat[0][0]/n_0}')
print(f'class 1 accuracy: {cf_mat[1][1]/n_1}')
运行示例 »
广告
尽管我们获得了非常高的准确度,但该模型没有提供有关数据的信息,因此它没有用。我们 100% 准确地预测类别 1,但在 0% 的情况下不准确地预测类别 0。以牺牲准确性为代价,最好有一个可以在一定程度上区分这两类的模型。
示例
# below are the probabilities obtained from a hypothetical model that doesn't always predict the mode
y_proba_2 = np.array(
np.random.uniform(0, .7, n_0).tolist() +
np.random.uniform(.3, 1, n_1).tolist()
)
y_pred_2 = y_proba_2 > .5
print(f'accuracy score: {accuracy_score(y, y_pred_2)}')
cf_mat = confusion_matrix(y, y_pred_2)
print('Confusion matrix')
print(cf_mat)
print(f'class 0 accuracy: {cf_mat[0][0]/n_0}')
print(f'class 1 accuracy: {cf_mat[1][1]/n_1}')
运行示例 »
对于第二组预测,我们的准确度分数不如第一组,但每个类别的准确度更加平衡。使用准确性作为评估指标,我们对第一个模型的评价会高于第二个模型,即使它没有告诉我们任何有关数据的信息。
在这种情况下,最好使用 AUC 等其他评估指标。
import matplotlib.pyplot as plt

 def plot_roc_curve(true_y, y_prob):
     """
     plots the roc curve based of the probabilities
     """

     fpr, tpr, thresholds = roc_curve(true_y, y_prob)
     plt.plot(fpr, tpr)
     plt.xlabel('False Positive Rate')
     plt.ylabel('True Positive Rate')
示例
型号1:
plot_roc_curve(y, y_proba)
print(f'model 1 AUC score: {roc_auc_score(y, y_proba)}')
结果

模型1 AUC评分:0.5
示例
型号2:
plot_roc_curve(y, y_proba_2)
print(f'model 2 AUC score: {roc_auc_score(y, y_proba_2)}')
结果

模型2 AUC得分:0.8270551578947367
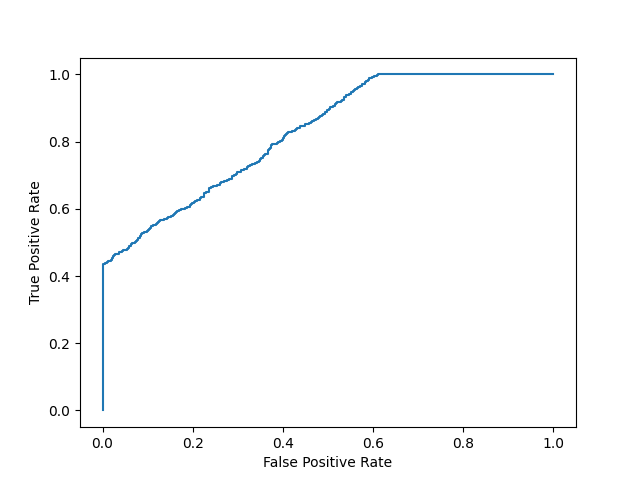
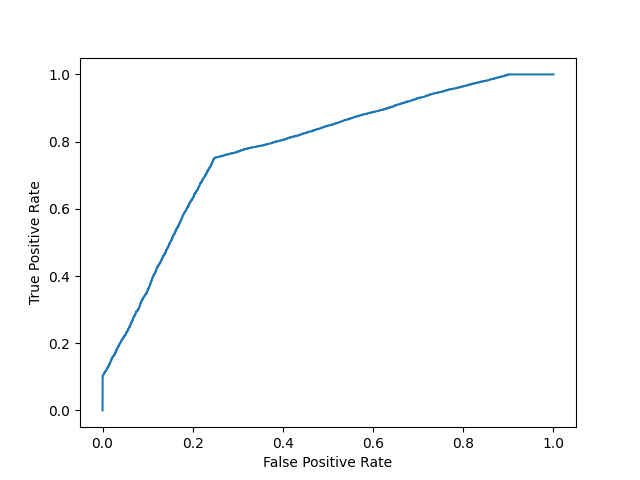
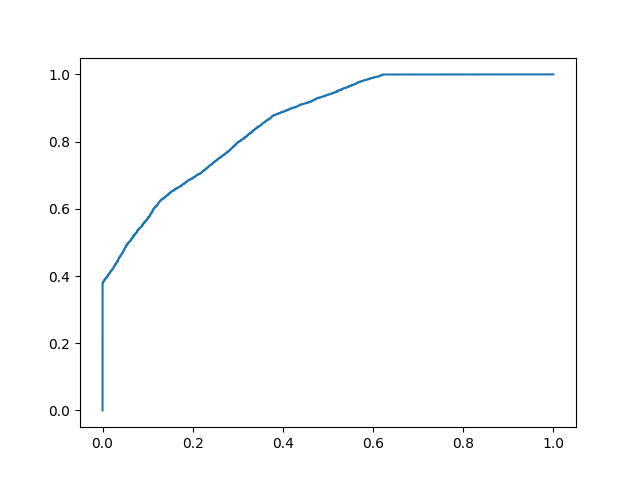
AUC 分数约为 0.5 意味着模型无法区分两个类别,并且曲线看起来像一条斜率为 1 的线。AUC 分数接近 1 意味着模型有能力将两个类分开,曲线将更接近图表的左上角。
概率
由于 AUC 是一种利用类预测概率的指标,因此我们可以对 AUC 分数较高的模型比分数较低的模型更有信心,即使它们具有相似的准确度。
在下面的数据中,我们有两组来自假设模型的概率。在预测两个类别时,第一个类别的概率不像"confident"(概率接近 0.5)。当预测两个类别时,第二个的概率更多"confident"(概率接近 0 或 1 的极值)。
示例
import numpy as np
n = 10000
y = np.array([0] * n + [1] * n)
#
y_prob_1 = np.array(
np.random.uniform(.25, .5, n//2).tolist() +
np.random.uniform(.3, .7, n).tolist() +
np.random.uniform(.5, .75, n//2).tolist()
)
y_prob_2 = np.array(
np.random.uniform(0, .4, n//2).tolist() +
np.random.uniform(.3, .7, n).tolist() +
np.random.uniform(.6, 1, n//2).tolist()
)
print(f'model 1 accuracy score: {accuracy_score(y, y_prob_1>.5)}')
print(f'model 2 accuracy score: {accuracy_score(y, y_prob_2>.5)}')
print(f'model 1 AUC score: {roc_auc_score(y, y_prob_1)}')
print(f'model 2 AUC score: {roc_auc_score(y, y_prob_2)}')
运行示例 »
尽管两个模型的准确度相似,但 AUC 分数较高的模型会更可靠,因为它考虑了预测概率。在预测未来数据时,它更有可能为您提供更高的准确性。
截取页面反馈部分,让我们更快修复内容!也可以直接跳过填写反馈内容!

