目录
-
Python 教程
- Python 主页
- Python 简介
- Python 入门
- Python 语法
- Python 注释
- Python 变量
- Python 数据类型
- Python 数字
- Python 类型转换
- Python 字符串
- Python 布尔值
- Python 运算符
- Python 列表
- Python 元组
- Python 集合
- Python 字典
- Python If...Else
- Python While 循环
- Python For 循环
- Python 函数
- Python Lambda
- Python 数组
- Python 类/对象
- Python 继承
- Python 迭代器
- Python 多态
- Python 作用域
- Python 模块
- Python 日期
- Python 数学
- Python JSON
- Python 正则表达式
- Python PIP
- Python Try...Except
- Python 用户输入
- Python 字符串格式化
- 文件处理
- Python 模块
- Python Matplotlib
- 机器学习
- Python MySQL
- Python MongoDB
- Python 参考
- 模块参考
- Python 如何使用
- Python 示例
Matplotlib 标签和标题
为绘图创建标签
通过 Pyplot,您可以使用xlabel()和 ylabel()为 x 轴和 y 轴设置标签的函数。
示例
向 x 轴和 y 轴添加标签:
import numpy as np
import matplotlib.pyplot as plt
x = np.array([80, 85, 90, 95, 100, 105, 110, 115, 120, 125])
y = np.array([240, 250, 260, 270, 280, 290, 300, 310, 320, 330])
plt.plot(x, y)
plt.xlabel("Average Pulse")
plt.ylabel("Calorie Burnage")
plt.show()
结果:

为图创建标题
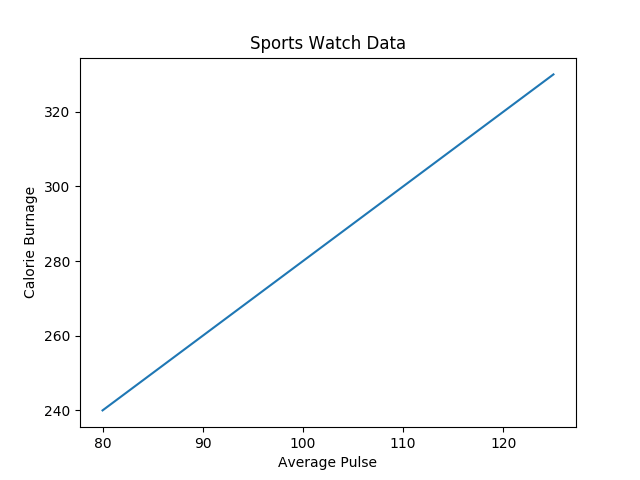
通过 Pyplot,您可以使用title()函数设置绘图的标题。
示例
添加绘图标题以及 x 轴和 y 轴标签:
import numpy as np
import matplotlib.pyplot as plt
x = np.array([80, 85, 90, 95, 100, 105, 110, 115, 120, 125])
y = np.array([240, 250, 260, 270, 280, 290, 300, 310, 320, 330])
plt.plot(x, y)
plt.title("Sports Watch Data")
plt.xlabel("Average Pulse")
plt.ylabel("Calorie Burnage")
plt.show()
结果:

设置标题和标签的字体属性
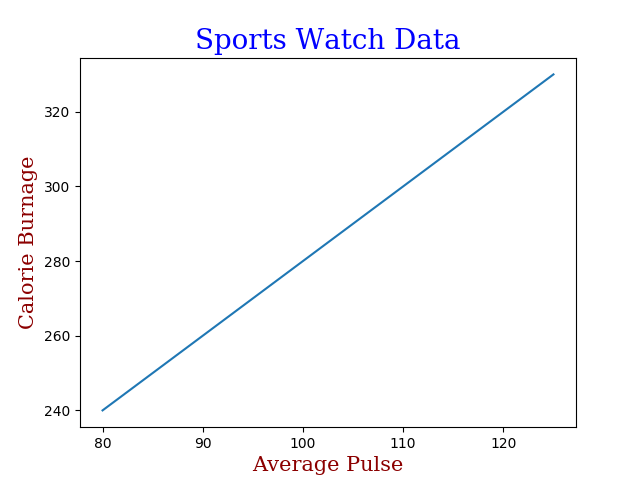
您可以使用fontdict参数输入xlabel(),ylabel(), 和title()设置标题和标签的字体属性。
示例
设置标题和标签的字体属性:
import numpy as np
import matplotlib.pyplot as plt
x = np.array([80, 85, 90, 95, 100, 105, 110, 115, 120, 125])
y = np.array([240, 250, 260, 270, 280, 290, 300, 310, 320, 330])
font1 = {'family':'serif','color':'blue','size':20}
font2 = {'family':'serif','color':'darkred','size':15}
plt.title("Sports Watch Data", fontdict = font1)
plt.xlabel("Average Pulse", fontdict = font2)
plt.ylabel("Calorie Burnage", fontdict = font2)
plt.plot(x, y)
plt.show()
结果:

定位标题
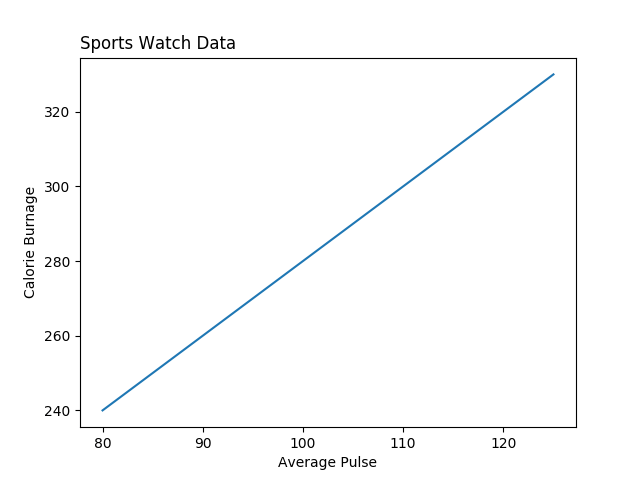
您可以使用loc参数输入title()来定位标题。
合法值为:“左”、“右”和“中”。默认值为“中心”。
示例
将标题置于左侧:
import numpy as np
import matplotlib.pyplot as plt
x = np.array([80, 85, 90, 95, 100, 105, 110, 115, 120, 125])
y = np.array([240, 250, 260, 270, 280, 290, 300, 310, 320, 330])
plt.title("Sports Watch Data", loc = 'left')
plt.xlabel("Average Pulse")
plt.ylabel("Calorie Burnage")
plt.plot(x, y)
plt.show()
结果:

截取页面反馈部分,让我们更快修复内容!也可以直接跳过填写反馈内容!