目录
-
Python Tutorial
- Python HOME
- Python Intro
- Python Get Started
- Python Syntax
- Python Comments
- Python Variables
- Python Data Types
- Python Numbers
- Python Casting
- Python Strings
- Python Booleans
- Python Operators
- Python Lists
- Python Tuples
- Python Sets
- Python Dictionaries
- Python If...Else
- Python While Loops
- Python For Loops
- Python Functions
- Python Lambda
- Python Arrays
- Python Classes/Objects
- Python Inheritance
- Python Iterators
- Python Polymorphism
- Python Scope
- Python Modules
- Python Dates
- Python Math
- Python JSON
- Python RegEx
- Python PIP
- Python Try...Except
- Python User Input
- Python String Formatting
- File Handling
- Python Modules
- Python Matplotlib
-
Machine Learning
- Getting Started
- Mean Median Mode
- Standard Deviation
- Percentile
- Data Distribution
- Normal Data Distribution
- Scatter Plot
- Linear Regression
- Polynomial Regression
- Multiple Regression
- Scale
- Train/Test
- Decision Tree
- Confusion Matrix
- Hierarchical Clustering
- Logistic Regression
- Grid Search
- Categorical Data
- K-means
- Bootstrap Aggregation
- Cross Validation
- AUC - ROC Curve
- K-nearest neighbors
- Python MySQL
- Python MongoDB
- Python Reference
- Module Reference
- Python How To
- Python Examples
Matplotlib Adding Grid Lines
Add Grid Lines to a Plot
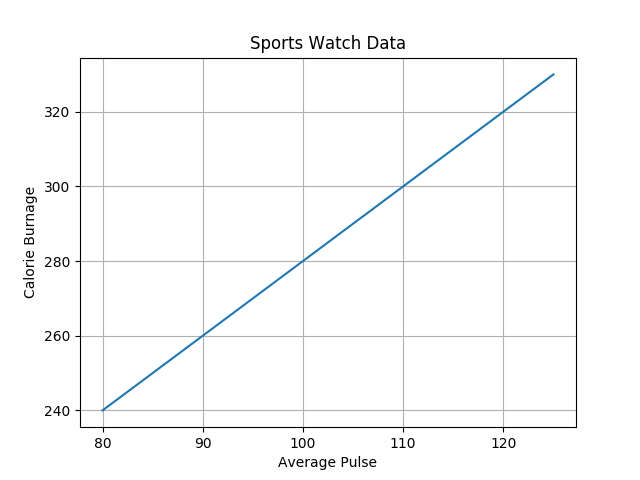
With Pyplot, you can use the grid() function to add grid lines to the plot.
Example
Add grid lines to the plot:
import numpy as np
import matplotlib.pyplot as plt
x = np.array([80, 85, 90, 95, 100, 105, 110, 115, 120, 125])
y = np.array([240, 250, 260, 270, 280, 290, 300, 310, 320, 330])
plt.title("Sports Watch Data")
plt.xlabel("Average Pulse")
plt.ylabel("Calorie Burnage")
plt.plot(x, y)
plt.grid()
plt.show()
Result:

Specify Which Grid Lines to Display
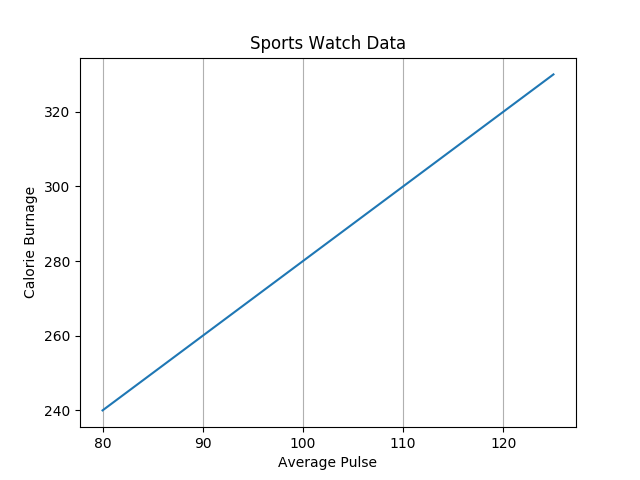
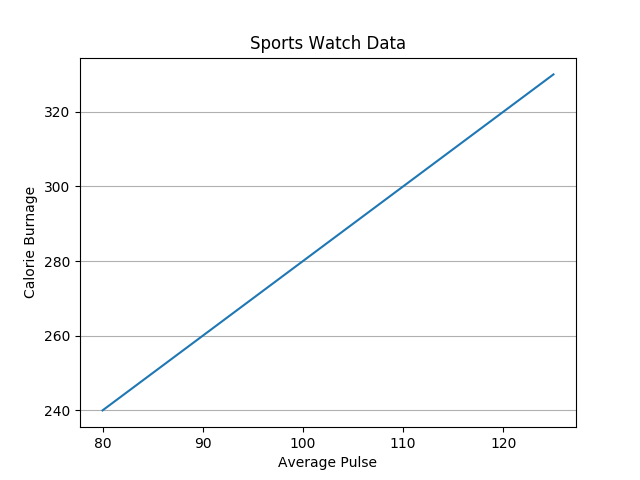
You can use the axis parameter in the grid() function to specify which grid lines to display.
Legal values are: 'x', 'y', and 'both'. Default value is 'both'.
Example
Display only grid lines for the x-axis:
import numpy as np
import matplotlib.pyplot as plt
x = np.array([80, 85, 90, 95, 100, 105, 110, 115, 120, 125])
y = np.array([240, 250, 260, 270, 280, 290, 300, 310, 320, 330])
plt.title("Sports Watch Data")
plt.xlabel("Average Pulse")
plt.ylabel("Calorie Burnage")
plt.plot(x, y)
plt.grid(axis = 'x')
plt.show()
Result:

Example
Display only grid lines for the y-axis:
import numpy as np
import matplotlib.pyplot as plt
x = np.array([80, 85, 90, 95, 100, 105, 110, 115, 120, 125])
y = np.array([240, 250, 260, 270, 280, 290, 300, 310, 320, 330])
plt.title("Sports Watch Data")
plt.xlabel("Average Pulse")
plt.ylabel("Calorie Burnage")
plt.plot(x, y)
plt.grid(axis = 'y')
plt.show()
Result:

Set Line Properties for the Grid
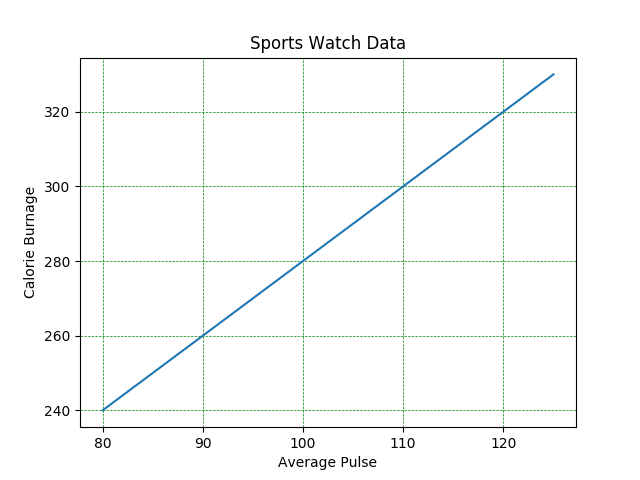
You can also set the line properties of the grid, like this: grid(color = 'color', linestyle = 'linestyle', linewidth = number).
Example
Set the line properties of the grid:
import numpy as np
import matplotlib.pyplot as plt
x = np.array([80, 85, 90, 95, 100, 105, 110, 115, 120, 125])
y = np.array([240, 250, 260, 270, 280, 290, 300, 310, 320, 330])
plt.title("Sports Watch Data")
plt.xlabel("Average Pulse")
plt.ylabel("Calorie Burnage")
plt.plot(x, y)
plt.grid(color = 'green', linestyle = '--', linewidth = 0.5)
plt.show()
Result:

截取页面反馈部分,让我们更快修复内容!也可以直接跳过填写反馈内容!