R 饼状图
饼状图
饼图是数据的圆形图形视图。
使用pie()绘制饼图的函数:
示例解释
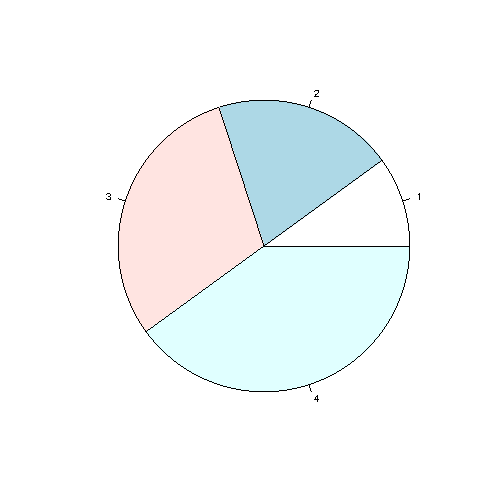
正如您所看到的,饼图为向量中的每个值(在本例中为 10、20、30、40)绘制一个饼图。
默认情况下,第一个饼图的绘制从 x 轴开始并移动逆时针。
笔记:每个饼图的大小是通过使用以下公式将该值与所有其他值进行比较来确定的:
该值除以所有值的总和:x/sum(x)
起始角度
您可以使用以下命令更改饼图的起始角度init.angle范围。
的值init.angle用以度为单位的角度定义,其中默认角度为 0。
示例
以 90 度开始第一个饼:
# Create a vector of pies
x <- c(10,20,30,40)
# Display the pie chart and start the first pie at 90 degrees
pie(x, init.angle = 90)
结果:

标签和标题
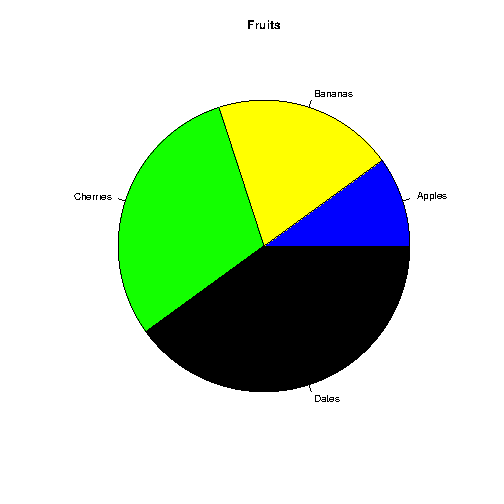
使用label参数向饼图添加标签,并使用main添加标题的参数:
示例
# Create a vector of pies
x <- c(10,20,30,40)
# Create a vector of labels
mylabel <- c("Apples", "Bananas", "Cherries", "Dates")
# Display the pie chart with labels
pie(x, label = mylabel, main = "Fruits")
结果:

颜色
您可以使用以下命令为每个饼图添加颜色col范围:
示例
# Create a vector of colors
colors <- c("blue", "yellow", "green", "black")
# Display the pie chart with colors
pie(x, label = mylabel, main = "Fruits", col = colors)
结果:
传奇
要为每个饼图添加解释列表,请使用legend()功能:
示例
# Create a vector of labels
mylabel <- c("Apples", "Bananas", "Cherries", "Dates")
# Create a vector of colors
colors <- c("blue", "yellow", "green", "black")
# Display the pie chart with colors
pie(x, label = mylabel, main = "Pie Chart", col = colors)
# Display the explanation box
legend("bottomright", mylabel, fill = colors)
结果:
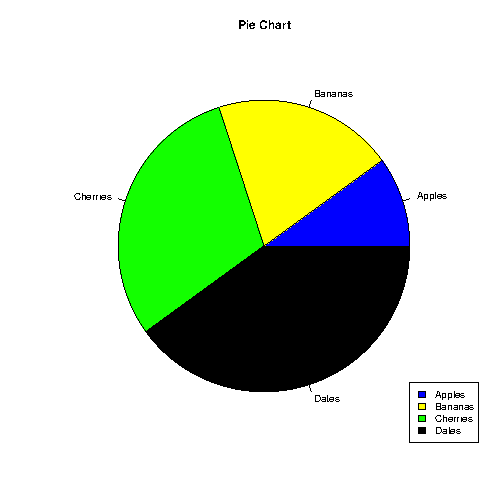
图例可以定位为:
bottomright, bottom, bottomleft, left, topleft, top, topright, right, center
截取页面反馈部分,让我们更快修复内容!也可以直接跳过填写反馈内容!